
A sales manager sent me a quarterly bar chart last month with one complaint: the title looked like a footnote next to the bars.
In this tutorial, I’ll change the matplotlib bar chart title font size on one chart, on every chart, and on a grid of bar charts.
Quick answer: pass fontsize to ax.set_title() (or plt.title()). Numbers are points; words like "x-large" scale from the base font:
ax.set_title("Q1 2026 Sales by Region", fontsize=20)Every number below came from real runs on Matplotlib 3.11.2 and Python 3.12.5.
Sample Data for the Bar Chart Title Examples
All examples share one file, region_sales.py, with made-up 2026 regional sales in USD. If Matplotlib isn’t there yet, install Matplotlib first.
regions = ["Northeast", "Southeast", "Midwest", "Southwest", "West"]
q1_sales = [184250.75, 162480.40, 139915.20, 121730.95, 205640.10]
q2_sales = [191870.30, 170215.85, 144060.50, 133415.25, 214980.65]

if __name__ == "__main__":
    for r, s in zip(regions, q1_sales):
        print(f"{r:<10} ${s:,.2f}")
Output:
Northeast  $184,250.75
Southeast  $162,480.40
Midwest    $139,915.20
Southwest  $121,730.95
West       $205,640.10
Change the Bar Chart Title Font Size with fontsize
The default title is 12 points, because axes.titlesize is "large" (1.2 times the 10-point base). Passing fontsize=20 replaces it:
import matplotlib.pyplot as plt
from region_sales import regions, q1_sales

fig, ax = plt.subplots(figsize=(7, 4), layout="constrained")
ax.bar(regions, [s / 1000 for s in q1_sales], color="#2F6DB5")
ax.set_ylabel("Sales (thousand USD)")
ax.set_title("Q1 2026 Sales by Region")
print("rcParams axes.titlesize:", plt.rcParams["axes.titlesize"])
print("Default title size:", ax.title.get_fontsize())

ax.set_title("Q1 2026 Sales by Region", fontsize=20)
print("After fontsize=20:", ax.title.get_fontsize())
plt.show()
Output:
rcParams axes.titlesize: large
Default title size: 12.0
After fontsize=20: 20.0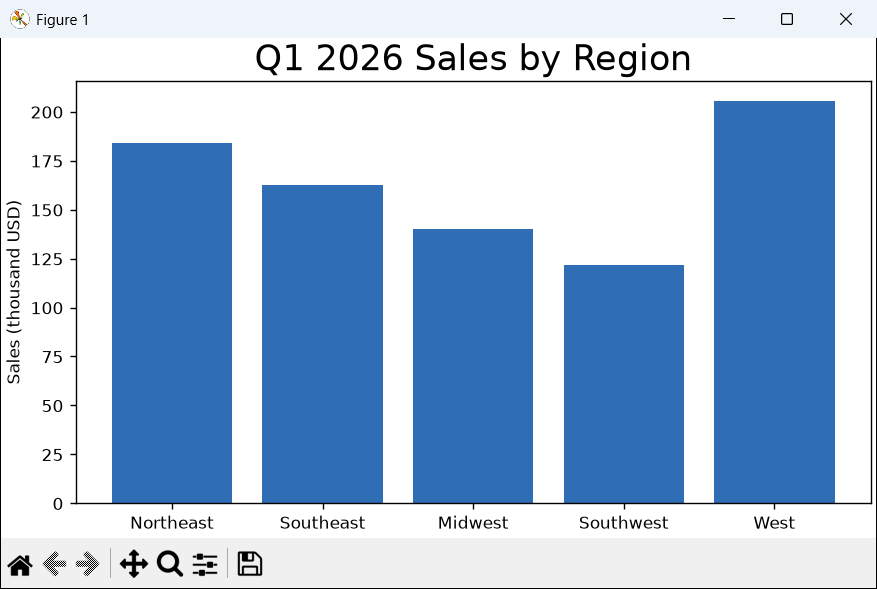
My Matplotlib title font size guide covers titles on every plot type.
How Do I Make a Bar Chart Title Bold and Larger at Once?
Same bars, now with fontdict, which bundles size, weight, family and color, while loc and pad move the title:
import matplotlib.pyplot as plt
from region_sales import regions, q1_sales

title_font = {"fontsize": 18, "fontweight": "bold",
              "family": "serif", "color": "#1B3A5C"}

fig, ax = plt.subplots(figsize=(7, 4), layout="constrained")
ax.bar(regions, [s / 1000 for s in q1_sales], color="#2F6DB5")
ax.set_ylabel("Sales (thousand USD)")
t = ax.set_title("Q1 2026 Sales by Region", fontdict=title_font,
                 loc="left", pad=14)
print(t.get_fontsize(), t.get_fontweight(), t.get_family())
plt.show()
Output:
18.0 bold ['serif']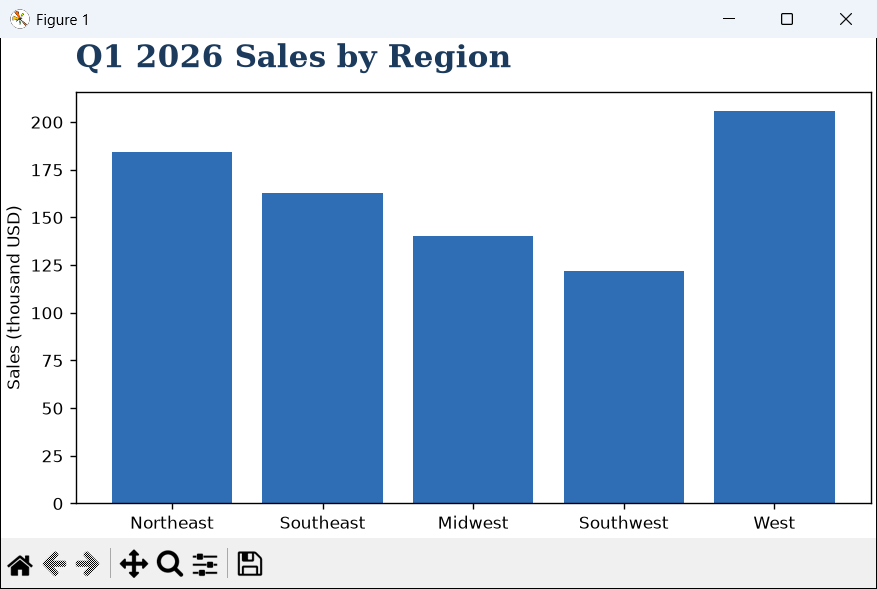
To restyle the bar values too, see Matplotlib bar chart labels.
Set the Title Font Size for Every Bar Chart with rcParams
For many charts, plt.rc_context() changes axes.titlesize only inside the with block:
import matplotlib.pyplot as plt
from region_sales import regions, q1_sales

for size in ["medium", "x-large", 22]:
    with plt.rc_context({"axes.titlesize": size}):
        fig, ax = plt.subplots()
        ax.bar(regions, q1_sales)
        ax.set_title("Q1 2026 Sales by Region")
        pt = round(ax.title.get_fontsize(), 1)
        print(f"axes.titlesize={size!r:<10} -> {pt} pt")
    plt.close(fig)
Output:
axes.titlesize='medium'   -> 10.0 pt
axes.titlesize='x-large'  -> 14.4 pt
axes.titlesize=22         -> 22.0 pt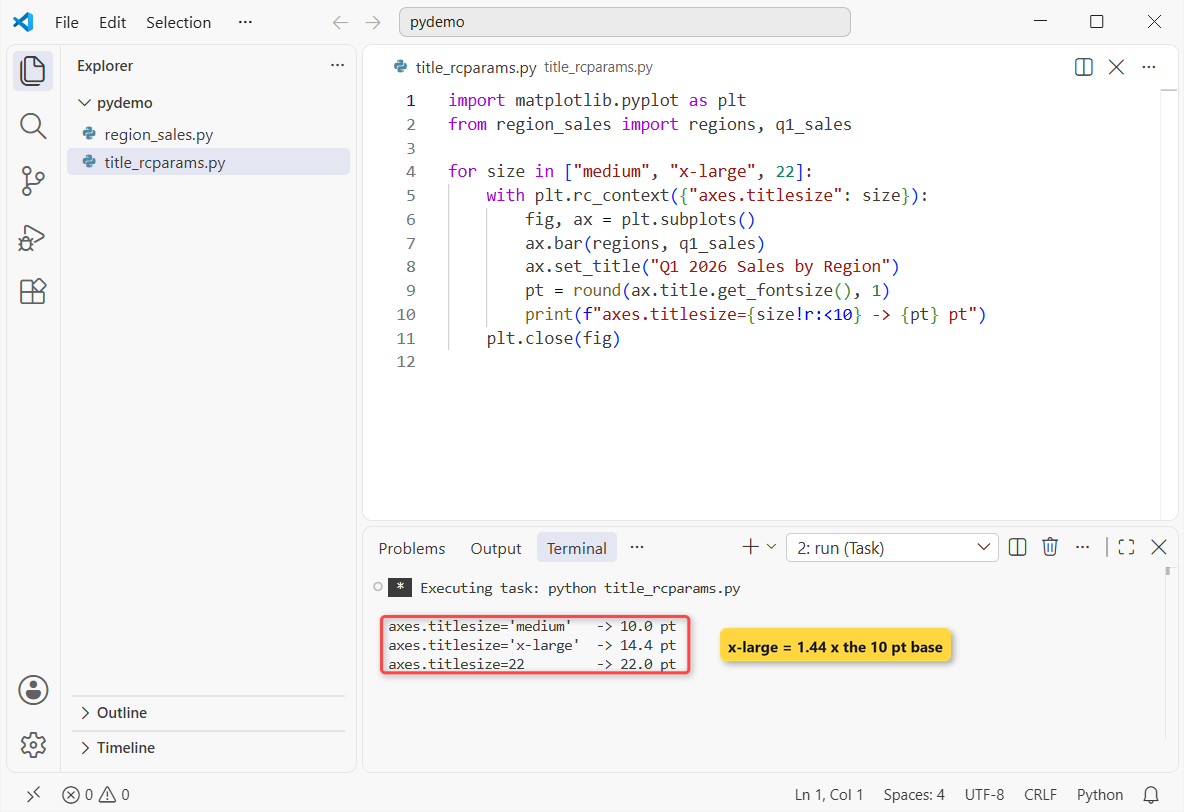
Note that "x-large" works out to 14.4 points. Tick labels ignore this setting; use tick_params for tick font size instead.
Change Subplot and suptitle Font Sizes on Bar Charts
Each axes gets its own set_title(), and fig.suptitle() sizes the overall title separately:
import matplotlib.pyplot as plt
from region_sales import regions, q1_sales, q2_sales

fig, (ax1, ax2) = plt.subplots(1, 2, figsize=(10, 4),
                               sharey=True, layout="constrained")
ax1.bar(regions, [s / 1000 for s in q1_sales], color="#2F6DB5")
ax2.bar(regions, [s / 1000 for s in q2_sales], color="#E07B39")
ax1.set_title("Q1 2026", fontsize=14)
ax2.set_title("Q2 2026", fontsize=14)
ax1.set_ylabel("Sales (thousand USD)")
for ax in (ax1, ax2):
    ax.tick_params(axis="x", labelrotation=30)

sup = fig.suptitle("Sales by Region, First Half of 2026",
                   fontsize=20, fontweight="bold")
print("Subplot titles:", ax1.title.get_fontsize(), ax2.title.get_fontsize())
print("suptitle:", sup.get_fontsize())
plt.show()
Output:
Subplot titles: 14.0 14.0
suptitle: 20.0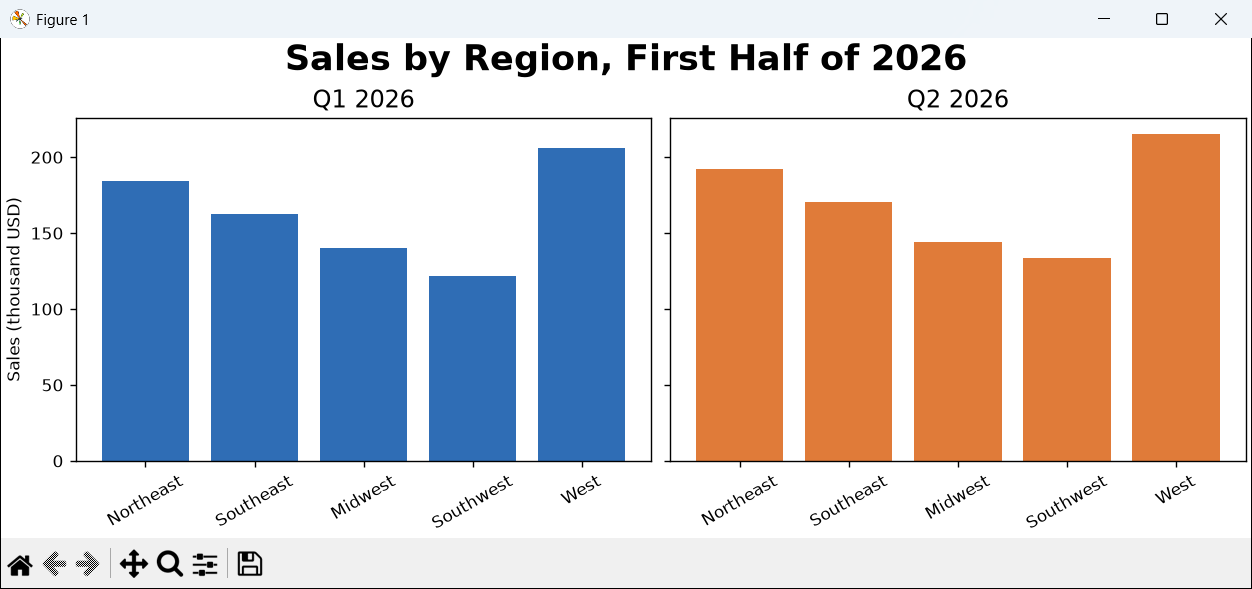
suptitle() follows figure.titlesize, not axes.titlesize. For bold subplot titles in bigger grids, read subplot title font size and bold.
Common Errors with Bar Chart Title Font Size
I hit all three of these on client work:
import matplotlib.pyplot as plt
from region_sales import regions, q1_sales

fig, ax = plt.subplots()
ax.bar(regions, q1_sales)

try:
    ax.set_title("Q1 2026 Sales", fontsize="huge")
except ValueError as err:
    print("ValueError:", str(err).split(".")[0])

ax.set_title("Q1 2026 Sales")
plt.rcParams["axes.titlesize"] = 24
print("Existing title:", ax.title.get_fontsize())

plt.title = "Q1 2026 Sales"
try:
    plt.title("Q1 2026 Sales", fontsize=18)
except TypeError as err:
    print("TypeError:", err)
Output:
ValueError: Size is invalid
Existing title: 12.0
TypeError: 'str' object is not callable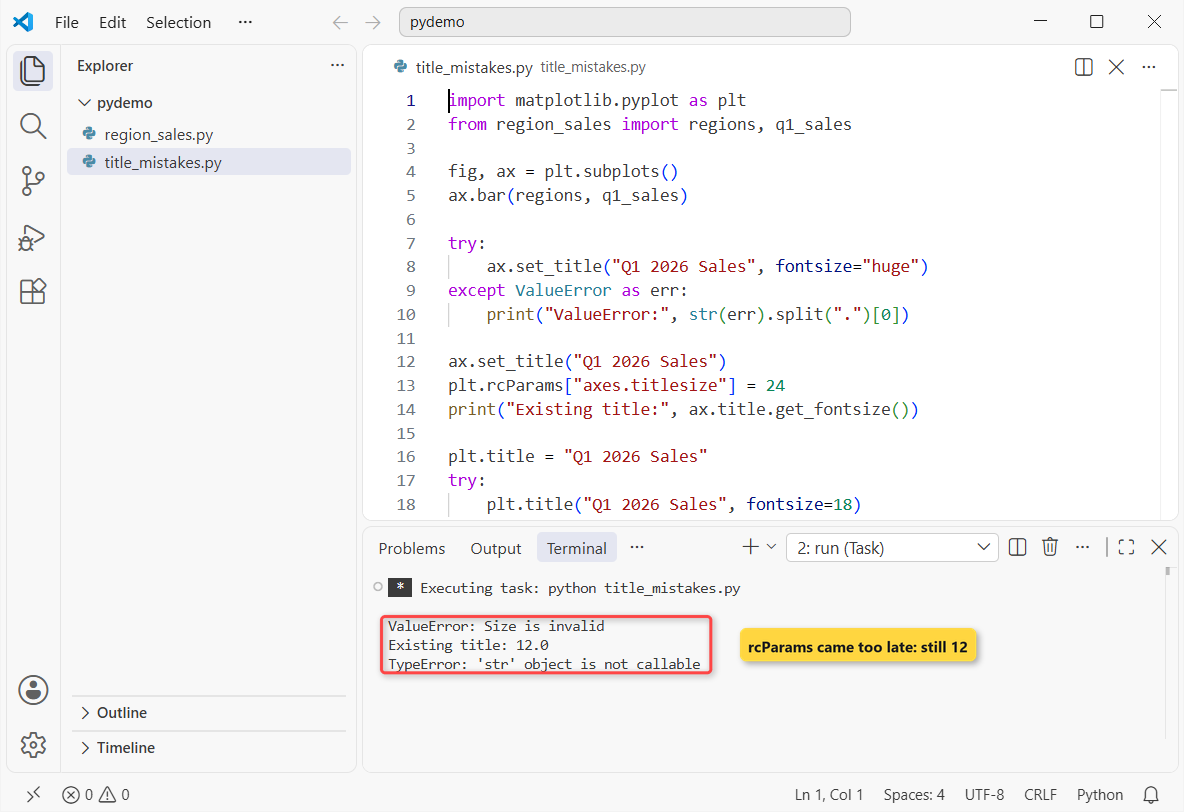
Valid names run from "xx-small" to "xx-large". Set rcParams before creating the chart, and restart the kernel if plt.title got overwritten. The same fixes apply to pie chart title font size.
You might also find these useful:
- Titles for each subplot and an overall title
- Change the Matplotlib legend font size
- Matplotlib x-axis label
- Save a Matplotlib chart as PNG
Frequently asked questions
How do I change the title font size of a bar chart in Matplotlib?
Use ax.set_title("Sales", fontsize=20).
What is the default title font size in Matplotlib?
12 points: axes.titlesize is "large", 1.2 times the 10-point base font.
How do I make a bar chart title bold?
Add fontweight="bold" to set_title() or put it in a fontdict.
How do I change the title size of all charts at once?
Set plt.rcParams["axes.titlesize"] before creating them.
Why doesn’t suptitle use axes.titlesize?
It follows figure.titlesize, so pass fontsize to suptitle().
Where is set_title documented?

Bijay Kumar is a 13-time Microsoft MVP with more than 18 years in software development, and the founder of Python Guides and TSinfo Technologies. He started out building .NET and SharePoint solutions at HP, TCS and KPIT before moving into Python, machine learning and AI, and he also builds web apps with TypeScript and React. He writes the tutorials here himself, and every example is run before publishing so you see the real output. More about Bijay · Microsoft MVP profile · LinkedIn