
A sales manager sent me a 2×2 Matplotlib dashboard last month with a short note: “I set wspace and hspace, called tight_layout, and my spacing vanished.” She wasn’t doing anything odd. That’s simply how the two features interact.
tight_layout() has no wspace or hspace arguments. It calculates those two values itself and writes them over whatever you set earlier, so the obvious fix of passing them in just raises a TypeError.
Quick answer: make the gaps bigger with w_pad and h_pad, or call subplots_adjust() after tight_layout() when you need exact values:
fig.tight_layout(w_pad=3, h_pad=2)              # automatic, roomier
fig.subplots_adjust(wspace=0.45, hspace=0.6)    # exact, set last
In this tutorial, I’ll show what Matplotlib tight_layout wspace hspace settings actually do on one dashboard, measure the values tight_layout writes, and fix the three errors people hit along the way.
The sample dashboard with crowded subplots
Every example uses the same data: monthly H1 2026 sales in USD for four US regions, one subplot each. I ran everything on Python 3.12.5 and Matplotlib 3.11.2.
import matplotlib.pyplot as plt

months = ["Jan", "Feb", "Mar", "Apr", "May", "Jun"]
sales = {   # USD, H1 2026
    "Northeast": [182400, 175900, 191250, 204800, 210300, 198750],
    "South": [156300, 161850, 170400, 168900, 181200, 189600],
    "Midwest": [121700, 118400, 127950, 133600, 139250, 142800],
    "West": [201500, 196300, 214700, 221900, 228400, 235100],
}

fig, axes = plt.subplots(2, 2, figsize=(8, 6))
for ax, (region, values) in zip(axes.flat, sales.items()):
    ax.plot(months, values, marker="o", color="#1f6fb2")
    ax.set_title(f"{region} sales, H1 2026")
    ax.set_xlabel("Month")
    ax.set_ylabel("Sales (USD)")

plt.show()
The default subplot parameters don’t know your labels exist. If you want every spacing option in one place, my guide to setting the spacing between subplots in Matplotlib covers them all.
What does tight_layout() do to wspace and hspace?
wspace is the gap between columns and hspace the gap between rows, both as a fraction of the average subplot width or height. Here’s the same dashboard, printing them at each step:
import matplotlib
matplotlib.use("Agg")
import matplotlib.pyplot as plt

# months and sales from the sample

fig, axes = plt.subplots(2, 2, figsize=(8, 6))
# same plotting loop as the sample

def show(step):
    p = fig.subplotpars
    print(f"{step:<31} wspace={p.wspace:.3f}  hspace={p.hspace:.3f}")

show("default")
fig.subplots_adjust(wspace=0.6, hspace=0.6)
show("subplots_adjust(0.6, 0.6)")
fig.tight_layout()
show("then tight_layout()")
fig.tight_layout(w_pad=4, h_pad=4)
show("tight_layout(w_pad=4, h_pad=4)")
fig.subplots_adjust(wspace=0.6)
show("subplots_adjust after it")
Output:
default                         wspace=0.200  hspace=0.200
subplots_adjust(0.6, 0.6)       wspace=0.600  hspace=0.600
then tight_layout()             wspace=0.336  hspace=0.378
tight_layout(w_pad=4, h_pad=4)  wspace=0.509  hspace=0.630
subplots_adjust after it        wspace=0.600  hspace=0.630
How does this code work?
fig.subplotpars holds the live layout values. subplots_adjust(wspace=0.6, hspace=0.6) sets them, then tight_layout() measures the labels and writes 0.336 and 0.378 instead, because that’s all this chart needs.
With w_pad=4, h_pad=4 it wrote 0.509 and 0.630. The general guide to Matplotlib tight_layout() explains pad and rect too.
Add more space between subplots with w_pad and h_pad
These are tight_layout’s own spacing knobs. w_pad controls the gap between columns and h_pad the gap between rows, measured in multiples of the font size, not as fractions. Same dashboard, with roomier gaps:
import matplotlib.pyplot as plt

# months and sales from the sample
fig, axes = plt.subplots(2, 2, figsize=(8, 6))
# same plotting loop as the sample

fig.tight_layout(w_pad=3, h_pad=2)   # gaps in multiples of the font size
plt.show()
How does this code work?
tight_layout first finds the space your labels need, then adds the padding on top. Because it’s based on font size, the spacing still fits when you make the fonts bigger.
I use this for nearly every grid I build. It also works on single charts with long labels, like the ones in fixing Matplotlib x-axis label spacing.
Set exact wspace and hspace after tight_layout()
Sometimes a report template needs fixed gaps. Order matters here: let tight_layout fix the outer margins, then call subplots_adjust() with only the values you want to pin.
import matplotlib.pyplot as plt

# months and sales from the sample
fig, axes = plt.subplots(2, 2, figsize=(8, 6))
# same plotting loop as the sample

fig.tight_layout()                   # fixes the outer margins first
fig.subplots_adjust(wspace=0.45, hspace=0.6)   # then exact gaps
plt.show()
How does this code work?
subplots_adjust() only changes the arguments you pass, so the left, right, top and bottom margins from tight_layout stay. The catch: change a label later and nothing re-checks it.
If your call seems to do nothing, read why subplots_adjust is not working. For outer margins only, see adjusting the bottom and right margins.
Use wspace and hspace with constrained layout instead
Constrained layout is the newer layout engine, and it’s the one place where wspace and hspace work together with automatic spacing. You set them on the engine:
import matplotlib.pyplot as plt

# months and sales from the sample
fig, axes = plt.subplots(2, 2, figsize=(8, 6), layout="constrained")
# same plotting loop as the sample

engine = fig.get_layout_engine()
print(engine.get())
engine.set(wspace=0.08, hspace=0.08)
plt.show()
Output:
{'h_pad': 0.04167, 'w_pad': 0.04167, 'hspace': 0.02, 'wspace': 0.02, 'rect': (0, 0, 1, 1)}
How does this code work?
engine.get() printed the defaults: wspace and hspace of 0.02 (a share of the figure), plus w_pad and h_pad of 0.04167 inches. Unlike tight_layout, it recalculates on every draw.
Needs Matplotlib 3.6+ for layout="constrained". The trade-offs are covered in Matplotlib constrained layout vs tight layout.
Common errors with tight_layout, wspace and hspace
These three came straight from my runs. The script prints each message instead of crashing:
import warnings
import matplotlib
matplotlib.use("Agg")
import matplotlib.pyplot as plt

warnings.simplefilter("always")
warnings.showwarning = lambda m, *a, **k: print("UserWarning:", m)

fig, axes = plt.subplots(2, 2)
try:
    fig.tight_layout(wspace=0.3)
except TypeError as err:
    print("TypeError:", err)

print("1) gridspec_kw spacing, then tight_layout():")
fig, axes = plt.subplots(2, 2, gridspec_kw={"wspace": 0.6})
fig.tight_layout()
print("   gridspec wspace is still", axes[0, 0].get_gridspec().wspace)

print("2) constrained layout, then subplots_adjust():")
fig, axes = plt.subplots(2, 2, layout="constrained")
fig.subplots_adjust(wspace=0.5)
Output:
TypeError: Figure.tight_layout() got an unexpected keyword argument 'wspace'
1) gridspec_kw spacing, then tight_layout():
UserWarning: This figure includes Axes that are not compatible with tight_layout, so results might be incorrect.
   gridspec wspace is still 0.6
2) constrained layout, then subplots_adjust():
UserWarning: This figure was using a layout engine that is incompatible with subplots_adjust and/or tight_layout; not calling subplots_adjust.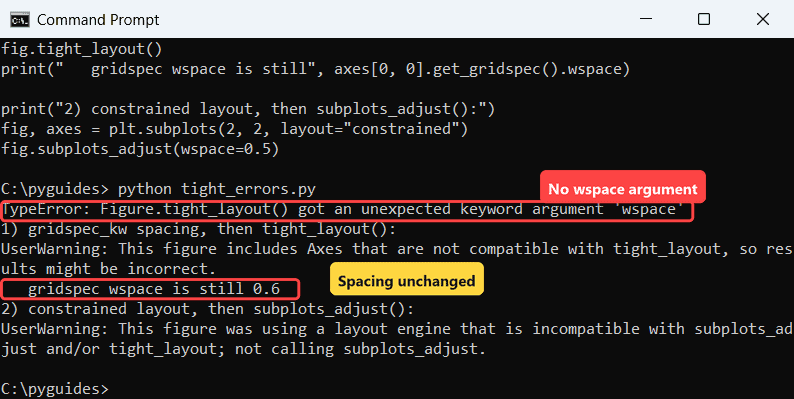
TypeError: unexpected keyword argument ‘wspace’. tight_layout only accepts pad, w_pad, h_pad and rect. Swap in w_pad and h_pad.
gridspec_kw spacing turns tight_layout off. With gridspec_kw={"wspace": 0.6}, tight_layout skipped the figure entirely; the column gap stayed exactly the same. Drop the gridspec value or skip tight_layout.
subplots_adjust is ignored under constrained layout. Use engine.set() instead. Colorbars bring their own issues, covered in tight_layout with colorbars and GridSpec.
Which spacing option should you pick?
| You want | Use |
|---|---|
| Automatic, a bit roomier | tight_layout(w_pad=3, h_pad=2) |
| Exact gaps for a template | tight_layout(), then subplots_adjust(wspace=, hspace=) |
| Automatic plus wspace/hspace | layout="constrained" + engine.set() |
| No overlap whe |