
To save a Matplotlib chart with a transparent background, pass transparent=True to savefig:
fig.savefig("chart.png", transparent=True)That clears the figure background and the axes background in the saved file. It changes nothing on screen, which is why people think it didn’t work.
Below I check every claim by reading the alpha channel back out of the saved PNG, on Matplotlib 3.11.2 on Python 3.12.5.
Proving it actually worked
A transparent PNG looks exactly like a white one against a white page. So rather than squint at it, open the file and read the corner pixel:
import matplotlib
matplotlib.use("Agg")
import matplotlib.pyplot as plt

fig, ax = plt.subplots(figsize=(5, 3))
ax.plot([1, 2, 3, 4], [10, 25, 18, 32], marker="o")
ax.set_title("Monthly signups")

fig.savefig("solid.png")                       # the default: opaque white
fig.savefig("clear.png", transparent=True)     # transparent figure and axes
plt.close(fig)

# read the corner pixel back out of each file to see what actually happened
from PIL import Image
for name in ("solid.png", "clear.png"):
    corner = Image.open(name).convert("RGBA").getpixel((0, 0))
    print(f"{name:<12} corner RGBA = {corner}")
Output:
solid.png    corner RGBA = (255, 255, 255, 255)
clear.png    corner RGBA = (255, 255, 255, 0)
255 is solid, 0 is fully transparent.That’s the whole test. If the fourth value comes back 255, whatever you tried didn’t take effect.
And here is the same chart dropped onto two coloured panels, which is what transparency buys you:
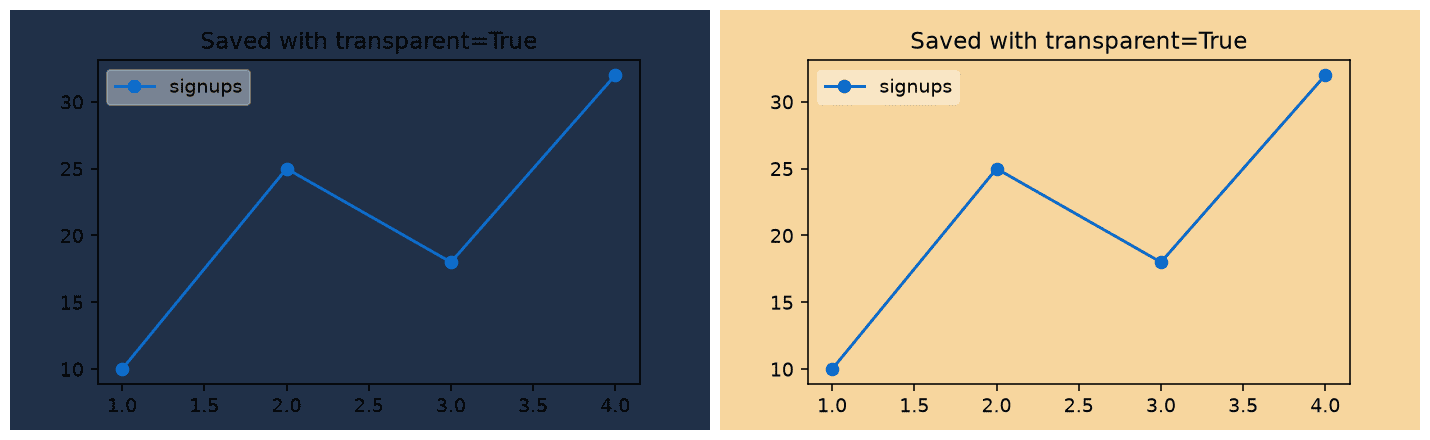
Figure and axes are two different backgrounds
Matplotlib has two patches stacked on each other. The figure patch is everything around the plot; the axes patch is the plotting area inside the spines.
Set them separately when you want the frame gone but the plotting area tinted:
import matplotlib
matplotlib.use("Agg")
import matplotlib.pyplot as plt
from PIL import Image

fig, ax = plt.subplots(figsize=(5, 3))
ax.plot([1, 2, 3, 4], [10, 25, 18, 32], marker="o")

fig.patch.set_alpha(0)        # the area around the axes
ax.patch.set_alpha(0.3)       # the plotting area itself

fig.savefig("patches.png")    # note: no transparent=True needed
plt.close(fig)

image = Image.open("patches.png").convert("RGBA")
print("outside the axes:", image.getpixel((5, 5)))
print("inside the axes :", image.getpixel((image.width // 2, image.height // 2)))
Output:
outside the axes: (255, 255, 255, 0)
inside the axes : (255, 255, 255, 77)
set_alpha(0) on both patches does the same job as transparent=True. The difference is that savefig only affects the file, while the patches belong to the figure itself.
Which setting wins
Two of these interact in a way that isn’t obvious, and it’s worth knowing before you start debugging a stubbornly white PNG.
import matplotlib
matplotlib.use("Agg")
import matplotlib.pyplot as plt
from PIL import Image

def chart():
    fig, ax = plt.subplots(figsize=(4, 2.5))
    ax.plot([1, 2, 3], [2, 4, 3])
    return fig, ax

def alpha(name, xy=(0, 0)):
    return Image.open(name).convert("RGBA").getpixel(xy)[3]

fig, ax = chart(); fig.set_facecolor("white")
fig.savefig("a.png", transparent=True); plt.close(fig)
print("figure facecolor white, then transparent=True :", alpha("a.png"))

fig, ax = chart(); ax.set_facecolor("#ffcccc")
fig.savefig("b.png", transparent=True); plt.close(fig)
print("axes facecolor pink, then transparent=True    :", alpha("b.png", (200, 125)))

fig, ax = chart()
fig.savefig("c.png", transparent=True, facecolor="white"); plt.close(fig)
print("transparent=True AND facecolor='white'        :", alpha("c.png"))

fig, ax = chart()
fig.savefig("d.png", facecolor="none"); plt.close(fig)
print("facecolor='none', no transparent argument     :", alpha("d.png"))
Output:
figure facecolor white, then transparent=True : 0
axes facecolor pink, then transparent=True    : 0
transparent=True AND facecolor='white'        : 255
facecolor='none', no transparent argument     : 0
transparent=True beats any facecolor you set on the figure or the axes beforehand. It wipes both, which is why the pink plotting area vanishes too.
But pass facecolor to the same savefig call and it wins instead. That combination is the usual reason transparency appears to be ignored.
So check the arguments in the save call itself first. A house style or wrapper that always passes facecolor="white" will quietly undo everything.
The last line is a third route worth knowing: facecolor="none" clears the figure background without touching the axes, which is handy when you want the plotting area to keep its fill.
JPEG cannot be transparent
There is no alpha channel in the JPEG format, so transparent=True is quietly ignored:
import matplotlib
matplotlib.use("Agg")
import matplotlib.pyplot as plt
from PIL import Image

fig, ax = plt.subplots(figsize=(4, 2.5))
ax.plot([1, 2, 3], [2, 4, 3])

fig.savefig("chart.png", transparent=True)
fig.savefig("chart.jpg", transparent=True)      # JPEG has no alpha channel
plt.close(fig)

for name in ("chart.png", "chart.jpg"):
    opened = Image.open(name)
    print(f"{name:<11} mode={opened.mode:<5} corner={opened.convert('RGBA').getpixel((0, 0))}")
Output:
chart.png   mode=RGBA  corner=(255, 255, 255, 0)
chart.jpg   mode=RGB   corner=(255, 255, 255, 255)
RGB, not RGBA: the JPEG has nowhere to store transparency.Use PNG, or SVG and PDF if you want it sharp at any size. If a JPEG is compulsory, set the background to whatever colour it will sit on and accept it.
Transparent data, not a transparent background
A good share of the people asking about Matplotlib transparency want the opposite thing: the marks on the chart made see-through, so overlapping data stops being a solid blob.
That’s alpha on the drawing call, and it has nothing to do with the background:
ax.scatter(x, y, alpha=0.08)      # 4000 points, each barely there
ax.plot(x, y, alpha=0.5)         # works on lines and bars too
For dense scatter plots, a low alpha turns overplotting into a density map for free. Values between 0.05 and 0.2 usually work for a few thousand points.
Making the legend see-through
Legends have their own background, and it stays opaque unless you ask otherwise. framealpha is the control:
import matplotlib
matplotlib.use("Agg")
import matplotlib.pyplot as plt

fig, ax = plt.subplots(figsize=(5.5, 3.2))
ax.plot([1, 2, 3, 4], [10, 25, 18, 32], marker="o", label="signups")
ax.plot([1, 2, 3, 4], [14, 12, 26, 30], marker="s", label="logins")

legend = ax.legend(
    framealpha=0.4,          # how opaque the box is: 0 invisible, 1 solid
    facecolor="lightblue",   # the box fill
    edgecolor="navy",        # the border
    fancybox=True,           # rounded corners
    loc="upper left",
)
legend.get_frame().set_linewidth(1.5)

print("framealpha :", legend.get_frame().get_alpha())
print("facecolor  :", legend.get_frame().get_facecolor())
fig.savefig("legend.png")
plt.close(fig)
print("saved legend.png")
Output:
framealpha : 0.4
facecolor  : (0.6784313725490196, 0.8470588235294118, 0.9019607843137255, 0.4)
saved legend.png| Argument | What it does | Handy values |
|---|---|---|
framealpha | Opacity of the legend box | 0 invisible, 0.4 see-through, 1 solid |
facecolor | Fill colour of the box | 'white', 'lightblue', 'none' |
edgecolor | Border colour | Any colour, or 'none' |
frameon | Draw the box at all | False removes it entirely |
fancybox | Rounded corners | True or False |
framealpha=0.4 is the usual compromise: the legend stays readable while the data underneath still shows. For more on styling the rest of the figure, see changing the background colour.
More Matplotlib guides on this site: