In this Python Matplotlib tutorial, we’ll discuss the Matplotlib 2d surface plot. Here we will cover different examples related to the 2d surface plot using matplotlib. And we will also cover the following topics:
- Matplotlib 2d surface plot
- Matplotlib 2d contour plot
- Matplotlib 2d color surface plot
Matplotlib 2d surface plot
Before the release of the 1.0 version, matplotlib is used only used for two-dimensional plotting. But after release 1.0, you can develop 3d utilities upon 2d utilities. Importing the mplot3d package enables the 3d plots.
A surface plot is the representation of a three-dimensional dataset. To create a surface plot we import Matplotlib’s mpl_toolkits.mplot3d toolkit which has functions to create a 3D surface plot.
The syntax to create the surface plot:
ax.plot_surface(X, Y, Z)Here our main motive is to generate two-dimensional data using matplotlib and plot it with three-dimensional effects i.e Surface.
Let’s see an example related to this:
- Here we need x and y values, and from x and y we compute the value of z called height.
- Then we use the z to plot on a map with axes x and y using the surface plot to get the 3D effects.
- We take x and y values in a one-dimensional array using the linspace method of numpy, then we need to convert them into a two-dimensional array, so we use meshgrid function of numpy.
Source Code:
# Import Library

import numpy as np

# 1D array


x = np.linspace(-10,10,50)
y = np.linspace(-10,10,50)

# Print Values

print('Value of X in 1D', x,'\n')
print ('Value of Y in 1D',y,'\n')

# Print Shapes


print('Shape of X in 1D',x.shape,'\n')
print('Shape of Y in 1D',y.shape,'\n')
# Convert 1D Array to 2D Array


x_2d, y_2d = np.meshgrid(x,y)

# Print Values


print('Value of X in 2D', x_2d,'\n')
print ('Value of Y in 2D',y_2d,'\n')

# Print Shapes

print('Shape of X in 2D',x_2d.shape,'\n')
print('Shape of Y in 2D',y_2d.shape,'\n')
# Compute Z

z = np.exp(np.cos(5*xx)-np.sin(5*yy))-0.5

# Print Value

print('Value of Z', z,'\n')

# Print Shape

print('Shape of Z',z.shape,'\n')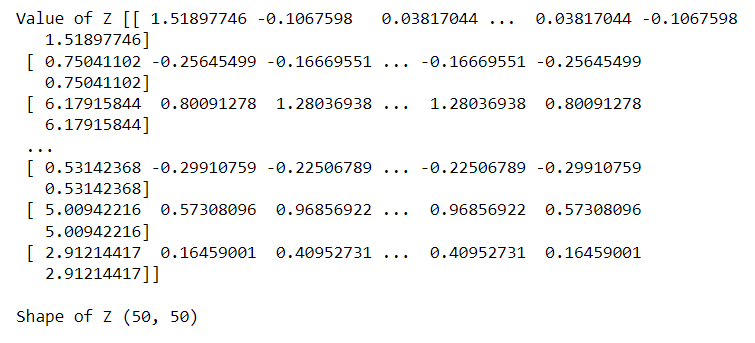
- Import from mpl_toolkits.mplot3d import Axes3D library.
- Import matplotlib.pyplot library.
- Generate and set the size of the figure, using plt.figure() function and figsize() method.
- Set the projection to 3d by defining axes object = add_subplot().
- Plot the surface, using plot_surface() function.
- To set axes labels at x, y, and z axes use set_xlabel(), set_ylabel(), and set_zlabel() functions respectively.
- To show the plot, use the show() function.
# Import Libraries

from mpl_toolkits.mplot3d import Axes3D
import matplotlib.pyplot as plt
import matplotlib.cm as cm

# 3D Projection

fig = plt.figure(figsize=(6,5))
ax = fig.add_subplot(111, projection='3d')

# Surface Plot

ax.plot_surface(x_2d, y_2d, z, cmap=cm.jet)

# Labels

ax.set_xlabel('X-Axis')
ax.set_ylabel('Y-Axis')
ax.set_zlabel('Z-Axis')

# Display

plt.show()
Let’s see one more example:
# Import Library

import numpy as np

# 1D array


x = np.linspace(-2,2,5)
y = np.linspace(-2,2,5)

# Print Values

print('Value of X in 1D', x,'\n')
print ('Value of Y in 1D',y,'\n')

# Print Shapes


print('Shape of X in 1D',x.shape,'\n')
print('Shape of Y in 1D',y.shape,'\n')

# Convert 1D Array to 2D Array


x_2d, y_2d = np.meshgrid(x,y)

# Print Values

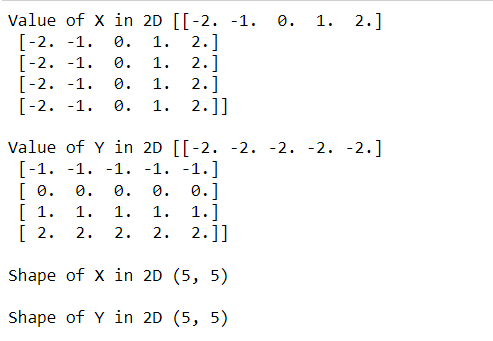
print('Value of X in 2D', x_2d,'\n')
print ('Value of Y in 2D',y_2d,'\n')

# Print Shapes


print('Shape of X in 2D',x_2d.shape,'\n')
print('Shape of Y in 2D',y_2d.shape,'\n')

# Compute Z

z = (np.exp(20*x_2d)-np.tan(5*y_2d**4))-1.5

# Print Value

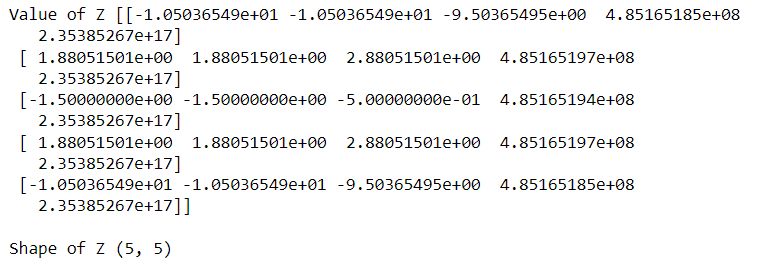
print('Value of Z', z,'\n')

# Print Shape


print('Shape of Z',z.shape,'\n')

# Import Libraries


from mpl_toolkits.mplot3d import Axes3D
import matplotlib.pyplot as plt
import matplotlib.cm as cm

# 3D Projection


fig = plt.figure(figsize=(6,5))
ax = fig.add_subplot(111, projection='3d')

# Surface Plot


ax.plot_surface(x_2d, y_2d,z, cmap=cm.flag)

# Labels


ax.set_xlabel('X-Axis')
ax.set_ylabel('Y-Axis')
ax.set_zlabel('Z-Axis')

# Display

plt.show()
Also, check Matplotlib xlim – Complete Guide
Matplotlib 2d contour plot
Contour plots, also known as level plots, are a multivariate analytic tool that allows you to visualize 3-D plots in 2-D space. When we plot X and Y as our variables, the response Z is shown as slices on the X-Y plane, which is why contours are sometimes referred to as Z-slices.
Use of Contour Plots:
Contour plots are commonly used in meteorological departments to illustrate densities, elevations, or mountain heights.
Create Contour Plots:
In matplotlib, matplotlib.pyplot includes a method contour to make it easy to construct contour plots due to its widespread use.
Syntax:
matplotlib.pyplot.contour([x, y, ] z, [levels], **kwargs)Parameters are as follow:
- x and y: Specifies 2D or 1D numpy array for plotting.
- z: Specifies the height over which contour is drawn.
- levels: The number and positions of the contour lines are determined.
Let’s see an example:
- We take x and y values in a one-dimensional array using the array method of numpy, then we need to convert them into a two-dimensional array, so we use the meshgrid function of numpy.
- Import from mpl_toolkits.mplot3d import Axes3D library.
- Import matplotlib.pyplot library.
- Import numpy library.
- Generate and set the size of the figure, using plt.figure() function and figsize() method.
- Set the projection to 3d by defining axes object = add_subplot().
- Plot the contour, using the contour() function.
- To set axes labels at x, y, and z axes use set_xlabel(), set_ylabel(), and set_zlabel() functions respectively.
- To show the plot, use the show() function.

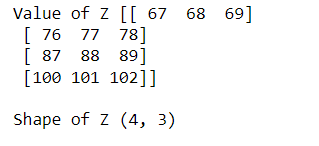
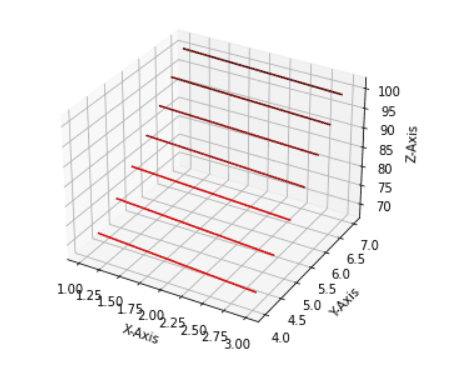
Let’s see one more example:
# Import Library

import numpy as np

# 1D array

x = np.linspace(-2,2,10)
y = np.linspace(-3,3,15)

# Print Values


print('Value of X in 1D', x,'\n')
print ('Value of Y in 1D',y,'\n')

# Print Shapes

print('Shape of X in 1D',x.shape,'\n')
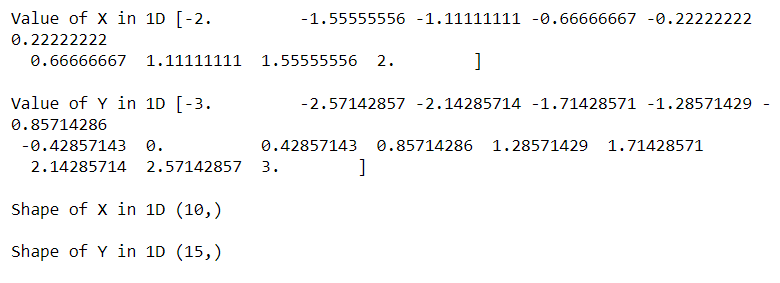
print('Shape of Y in 1D',y.shape,'\n')- We use the array method of numpy to get x and y values in a one-dimensional array, then use the meshgrid function of numpy to transform them to a two-dimensional array.
# Convert 1D Array to 2D Array

x_2d, y_2d = np.meshgrid(x,y)

# Print Values

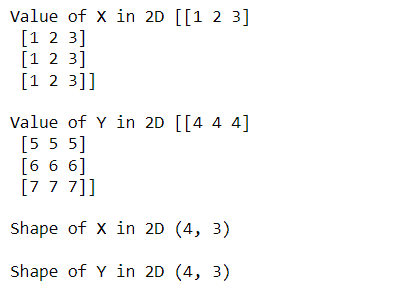
print('Value of X in 2D', x_2d,'\n')
print ('Value of Y in 2D',y_2d,'\n')

# Print Shapes

print('Shape of X in 2D',x_2d.shape,'\n')
print('Shape of Y in 2D',y_2d.shape,'\n')
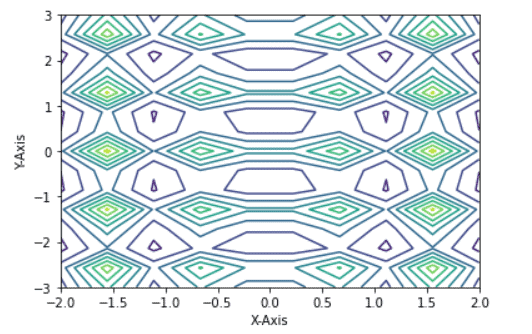
- Then we use the z to plot on a map with axes x and y using the contour plot.
# Compute z


z = np.exp(np.cos(4*x_2d)**2-np.sin(5*y_2d)**2)-0.8

# Print Values

print('Value of Z', z,'\n')

# Print Shape

print('Shape of Z',z.shape,'\n')- Import matplotlib.pyplot library
- To plot a contour plot, use contour() function.
- To add x-axis labels, use xlabel() function.
- To add y-axis label, use ylabel() function.
- To display a plot, use show() function.
Read: Matplotlib 3D scatter
Matplotlib 2d color surface plot
The Matplotlib library’s pyplot module’s pcolor() method is used in the creation of a pseudo-color plot with a non-regular rectangular grid.
The syntax is given below:
matplotlib.pyplot.pcolor(*args, alpha=None, norm=None,
                         cmap=None, vmin=None, vmax=None,
                         data=None, **kwargs)
Let’s see an example:
- Here we need x and y values, and from x and y we compute the value of z called height.
- Then we use the z to plot on a map with axes x and y using the color plot.
# Import Library

import numpy as np

# 1D array

x = np.linspace(-2,2,10)
y = np.linspace(-3,3,15)

# Print Values

print('Value of X in 1D', x,'\n')
print ('Value of Y in 1D',y,'\n')

# Print Shapes

print('Shape of X in 1D',x.shape,'\n')
print('Shape of Y in 1D',y.shape,'\n')
- We take x and y values in a one-dimensional array using the linspace method of numpy, then we need to convert them into a two-dimensional array, so we use meshgrid function of numpy.

# Compute z

z = np.exp(np.sin(4*x_2d+y_2d)**2)-2.5

# Print Value

print('Value of Z', z,'\n')

# Print Shape

print('Shape of Z',z.shape,'\n')
- Import matplotlib.pyplot library.
- To plot a 2d color surface plot, use pcolor() function.
- Set edgecolor and linewidth to black and 2 respectively.
- To add x-axis labels, use xlabel() function.
- To add y-axis label, use ylabel() function.
- To display a plot, use show() function.
# Import Library

import matplotlib.pyplot as plt

# Color Plot

plt.pcolor(x, y, z, edgecolors='k', linewidths=2)

# Labels

plt.xlabel('X-Axis')
plt.ylabel('Y-Axis')

# Show

plt.show()
Let’s see one more example:
- Here we need x and y values, and from x and y we compute the value of z called height.
- We use the linspace method of numpy to convert x and y values into a one-dimensional array, and then we use the meshgrid function of numpy to transform them into a two-dimensional array.
- Import the matplotlib.pyplot library into your project.
- Use the pcolor() method to create a two-dimensional colour surface plot.
- Set the linewidth and edgecolor to 2 and black, respectively.
- Use the xlabel() function to add x-axis labels.
- Use the ylabel() function to add a y-axis label.
- Use the show() function to display a plot.
Source Code:
# Import Library

import numpy as np

# 1D array

x = np.linspace(-5,5,10)
y = np.linspace(-1,1,35)

# Print Values

print('Value of X in 1D', x,'\n')
print ('Value of Y in 1D',y,'\n')

# Print Shapes

print('Shape of X in 1D',x.shape,'\n')
print('Shape of Y in 1D',y.shape,'\n')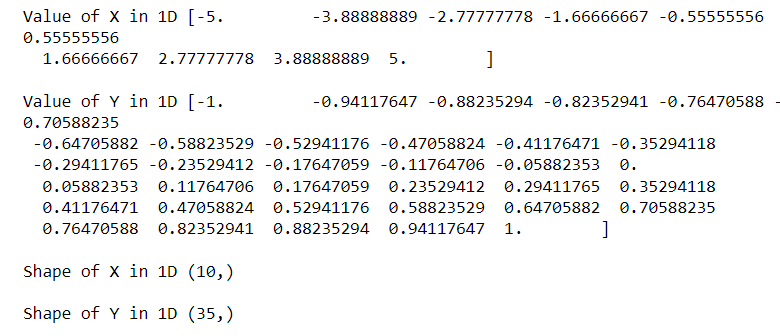
# Convert 1D Array to 2D Array

x_2d, y_2d = np.meshgrid(x,y)

# Print Values

print('Value of X in 2D', x_2d,'\n')
print ('Value of Y in 2D',y_2d,'\n')

# Print Shapes

print('Shape of X in 2D',x_2d.shape,'\n')
print('Shape of Y in 2D',y_2d.shape,'\n')

# Compute z

z = (x_2d**4+y_2d**6)+2

# Print Value

print('Value of Z', z,'\n')

# Print Shape


print('Shape of Z',z.shape,'\n')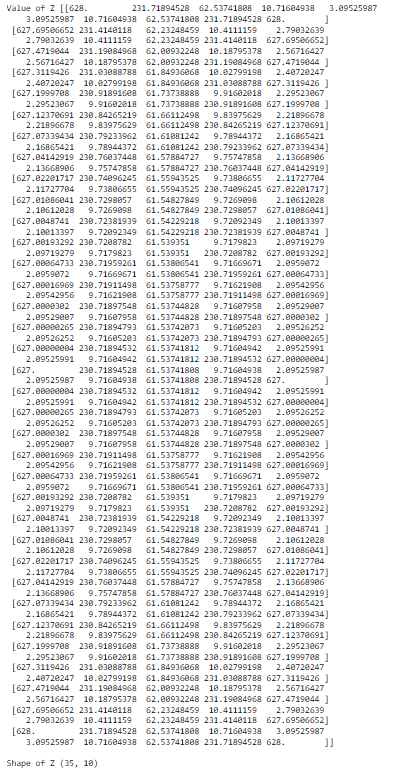
# Import Library

import matplotlib.pyplot as plt

# Color Plot

plt.pcolor(x, y, z, edgecolors='k', linewidths=2)

# Labels

plt.xlabel('X-Axis')
plt.ylabel('Y-Axis')

# Show

plt.show()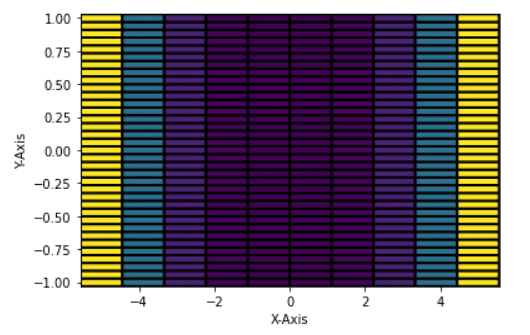
You may also like to read the following Matplotlib tutorials.
- Stacked Bar Chart Matplotlib
- Matplotlib scatter plot legend
- Matplotlib increase plot size
- Matplotlib legend font size
- Matplotlib tight_layout
- What is add_axes matplotlib
- Draw vertical line matplotlib
In this Python tutorial, we have discussed the “Matplotlib 2d surface plot” and we have also covered some examples related to it. These are the following topics that we have discussed in this tutorial.
- Matplotlib 2d surface plot
- Matplotlib 2d contour plot
- Matplotlib 2d color surface plot

I am Bijay Kumar, a Microsoft MVP in SharePoint. Apart from SharePoint, I started working on Python, Machine learning, and artificial intelligence for the last 5 years. During this time I got expertise in various Python libraries also like Tkinter, Pandas, NumPy, Turtle, Django, Matplotlib, Tensorflow, Scipy, Scikit-Learn, etc… for various clients in the United States, Canada, the United Kingdom, Australia, New Zealand, etc. Check out my profile.