Do you want to do a cross-tabulation with percentages of a dataframe? In this Pandas article, I will explain “How to create Pandas crosstab percentage in Python?“
Pandas provide a variety of methods to work with datasets in Python. One of them is the crosstab method in Python, which is used to calculate the frequency of occurrences between two or more factors and cross-tabulations.
To learn more about the crosstab() function in Pandas, you can check our article: What is the pd.crosstab function in Python
Syntax of Pandas Crosstab in Python:
Here is the syntax of the pd.crosstab() function in Python:
pd.crosstab(index, columns, values=None, aggfunc=None, rownames=None, colnames=None, margins=False, margins_name='All', dropna=True, normalize=False)Here,
| Parameters | Description |
|---|---|
| index | The values to group by in the rows. |
| columns | The values to group by in the columns. |
| values | (Optional) The aggregate values. If not specified, it will count occurrences. |
| aggfunc | (Optional) The aggregation function applies to values. The default is None (counts occurrences). |
| rownames and colnames | (Optional) Names to assign to the resulting rows and columns. |
| margins | (Optional) Whether to add row/column margins (totals). |
| margins_name | (Optional) The name of the margin (if enabled). |
| dropna | (Optional) Whether to exclude missing values. The default is True. |
| normalize | (Optional) Whether to normalize by dividing all values by the sum of values. The default is False. |
Create Pandas Crosstab Percentage in Python
To compute percentages using Pandas crosstab in Python, we can utilize the normalize parameter in the pd.crosstab.
By setting it to True, Pandas automatically calculates the percentages for us. We can specify the requirements, like percentages across rows, columns, or the entire table.
Here is a basic example:
import pandas as pd

Company = {
    'Department': ['Engineering', 'Engineering', 'Engineering', 'Engineering',
                   'Marketing', 'Marketing', 'Marketing', 'Marketing',
                   'Sales', 'Sales', 'Sales', 'Sales'],
    'Performance': ['Excellent', 'Good', 'Fair', 'Poor',
                    'Excellent', 'Good', 'Fair', 'Poor',
                    'Excellent', 'Good', 'Fair', 'Poor']
}
df = pd.DataFrame(Company)
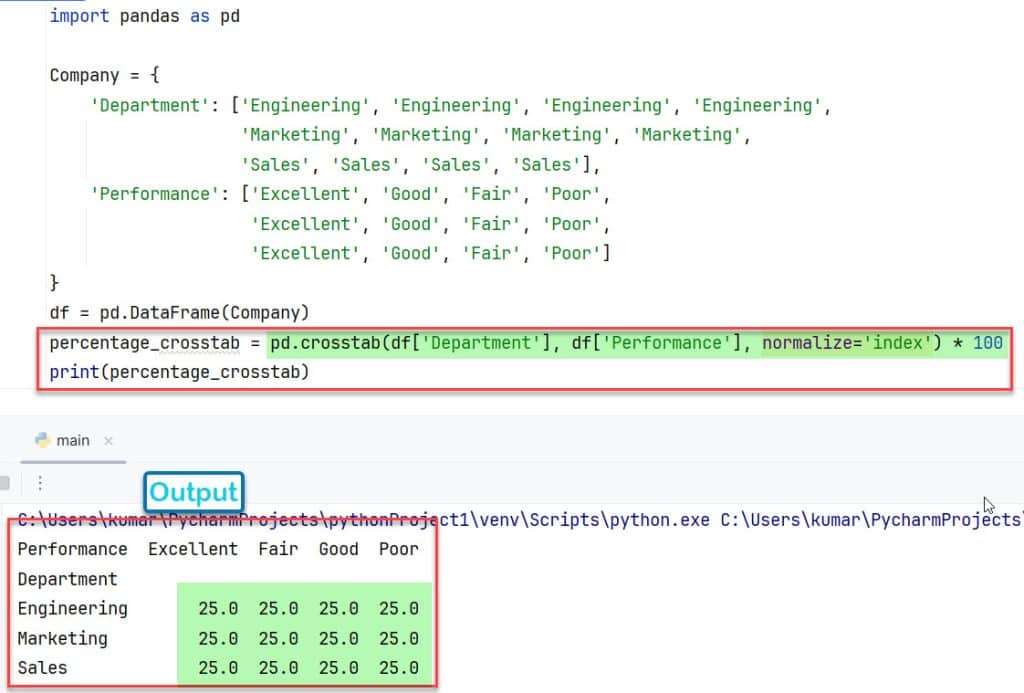
percentage_crosstab = pd.crosstab(df['Department'], df['Performance'], normalize='index') * 100
print(percentage_crosstab)
Output: The normalize provides the average. So, for percentage calculation, we have to multiply the result by 100.
Performance  Excellent  Fair  Good  Poor
Department
Engineering       25.0  25.0  25.0  25.0
Marketing         25.0  25.0  25.0  25.0
Sales             25.0  25.0  25.0  25.0
After implementing the code in the Pycharm editor, the screenshot is mentioned below.

Let’s see some more examples that will illustrate the pd.crosstab percentage well:
1. pd.crosstab percentage for rows total
Index normalization in the context of pd.crosstab means normalizing the values along the rows (index). This type of normalization calculates the percentage of each value with respect to the total of its corresponding row.
Here is an example:
import pandas as pd

Sales_data = {
    'Salesperson': ['Alice', 'Bob', 'Alice', 'Bob', 'Alice', 'Bob'],
    'Region': ['North', 'North', 'South', 'South', 'East', 'East'],
    'Products Sold': [10, 20, 15, 25, 30, 40]
}

df = pd.DataFrame(Sales_data)
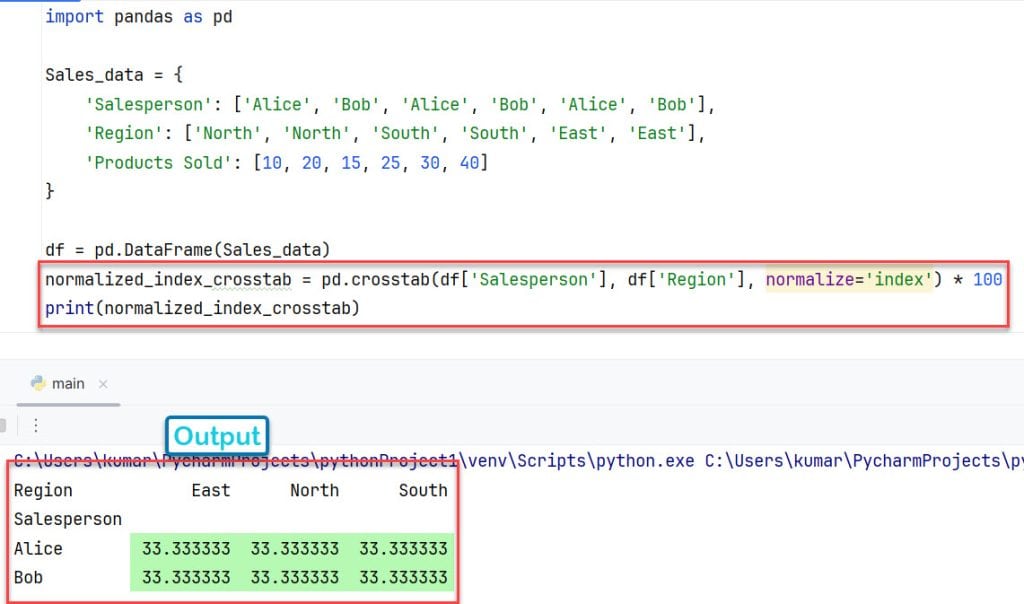
normalized_index_crosstab = pd.crosstab(df['Salesperson'], df['Region'], normalize='index') * 100
print(normalized_index_crosstab)
Output: In this example, the resulting crosstab with index normalization will display the percentage of products sold by each salesperson in each region relative to the total number of products sold.
Region            East      North      South
Salesperson
Alice        33.333333  33.333333  33.333333
Bob          33.333333  33.333333  33.333333
A screenshot is mentioned below, after implementing the code in the Pycharm editor.

2. How to make a Pandas crosstab with percentages for column total
Column normalization in Python Pandas involves normalizing the values along the columns. It calculates the percentage of each value with respect to the total of its corresponding column.
Let’s see an instance:
import pandas as pd

Sales_data = {
    'Salesperson': ['Alice', 'Bob', 'Alice', 'Bob', 'Alice', 'Bob'],
    'Region': ['North', 'North', 'South', 'South', 'East', 'East'],
    'Products Sold': [10, 20, 15, 25, 30, 40]
}

df = pd.DataFrame(Sales_data)
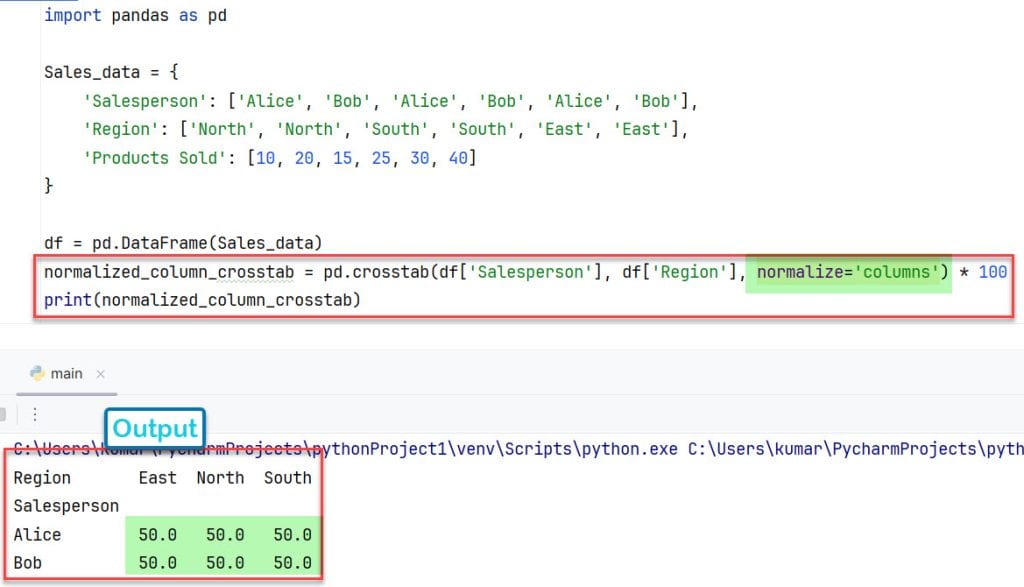
normalized_column_crosstab = pd.crosstab(df['Salesperson'], df['Region'], normalize='columns') * 100
print(normalized_column_crosstab)
Output: Here, the resulting Pandas crosstab in Python with column normalization will display the percentage of products sold in each region relative to the total number of products sold in that region.
Region       East  North  South
Salesperson
Alice        50.0   50.0   50.0
Bob          50.0   50.0   50.0
After executing the code in Pycharm, one can see the output in the below screenshot.

3. Pandas Percentage of Crosstab in Python to all values
Total normalization, also known as all normalization in Python. This calculates the percentage of each value with respect to the total of all values in the crosstab Python Pandas.
import pandas as pd

Sales_data = {
    'Salesperson': ['Alice', 'Bob', 'Alice', 'Bob', 'Alice', 'Bob'],
    'Region': ['North', 'North', 'South', 'South', 'East', 'East'],
    'Products Sold': [10, 20, 15, 25, 30, 40]
}

df = pd.DataFrame(Sales_data)
total_normalized_crosstab = pd.crosstab(df['Salesperson'], df['Region'], normalize='all') * 100
print(total_normalized_crosstab)
Output: This will result in a Pandas crosstab where each value represents the percentage of products sold in each region by each salesperson relative to the total number of products sold overall.
Region            East      North      South
Salesperson
Alice        16.666667  16.666667  16.666667
Bob          16.666667  16.666667  16.666667
Below is a screenshot displaying the output after implementing the Pycharm editor’s code.

Conclusion
Through this article, I have explained How to create Pandas crosstab percentage in Python in detail with the help of the normalize argument in the pd.crosstab() method in Python. Here, I have taken three different examples to illustrate how to make a Pandas crosstab with percentages, like to all values, to rows values, and to column values.
You may also like to read:
- Pandas Dataframe drop() function in Python
- How to drop non-numeric columns from Pandas DataFrame
- How to Remove All Non-numeric Characters in Pandas

I am Bijay Kumar, a Microsoft MVP in SharePoint. Apart from SharePoint, I started working on Python, Machine learning, and artificial intelligence for the last 5 years. During this time I got expertise in various Python libraries also like Tkinter, Pandas, NumPy, Turtle, Django, Matplotlib, Tensorflow, Scipy, Scikit-Learn, etc… for various clients in the United States, Canada, the United Kingdom, Australia, New Zealand, etc. Check out my profile.